


The euro broke below the parity level (1.0000) against the US dollar again on August 22, 2022, following a fresh wave of selling pressure prompted by deteriorating risk sentiment in Europe.
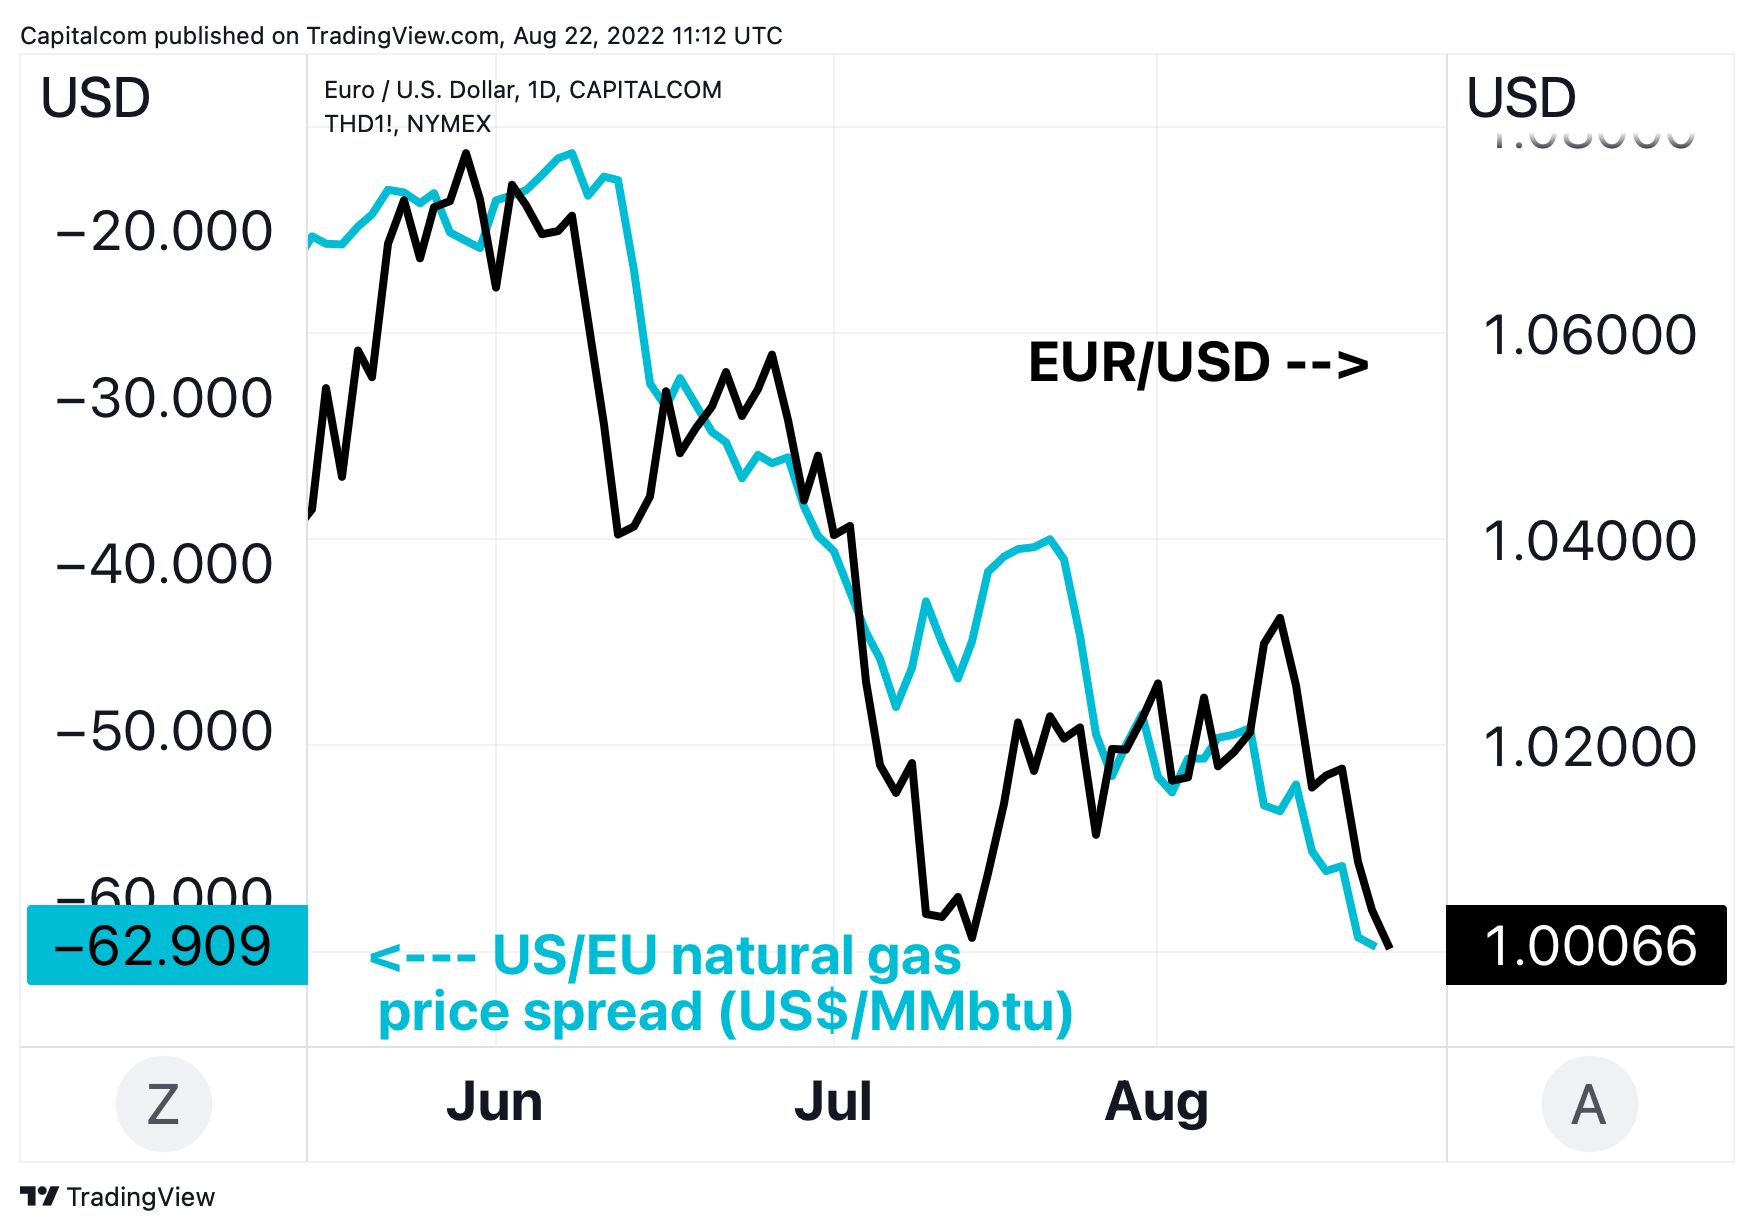
The recent price action in EUR/USD hasn’t been driven by the widening of interest rate differentials between the Fed and the ECB, but rather by the widening price differential between European and US natural gas.
EUR/USD chart: Euro to fall further on widening Dutch TTF-Henry Hub gas spread?
EUR/USD analysis: Natural gas price differential, not yields, is the driving factor now
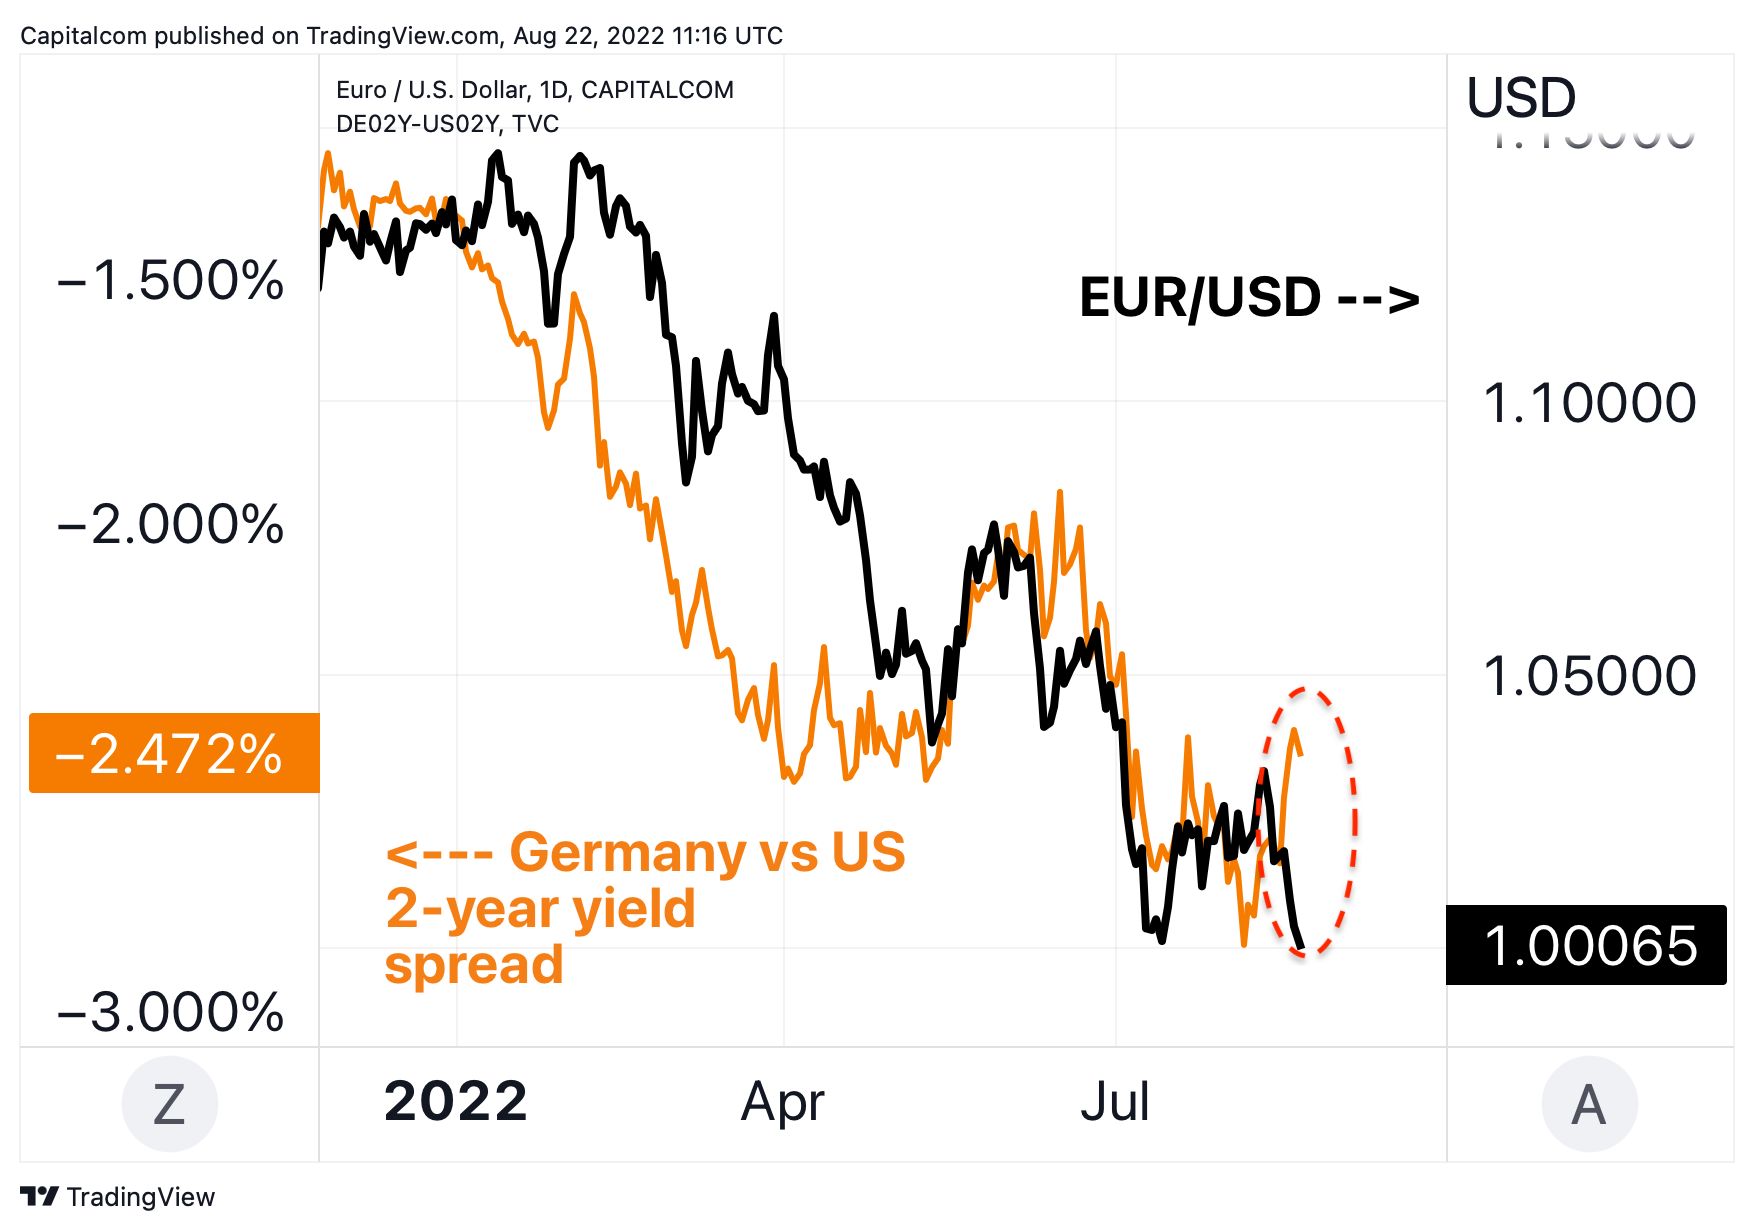
Since the ECB began its cycle of rate hikes in July, the monetary policy gap between the Federal Reserve and the ECB, which had been the primary factor driving the EUR/USD pair in the first half of the year, has had a diminishing effect on the exchange rate.
EUR/USD has recently detached from the spread between German and US 2-year yields in order to more accurately reflect trade disparities between the two regions.
A new factor exerting downward pressure on EUR/USD has been the divergence between European and U.S. natural gas prices, as we’ve noted in recent weeks. The US Henry Hub is currently trading at a $62/MMBtu discount (or about 6 times lower) to the European Dutch TTF, the widest price discount since the start of the year.
EUR/USD long-term technical analysis chart: Is 0.96 the next stop?
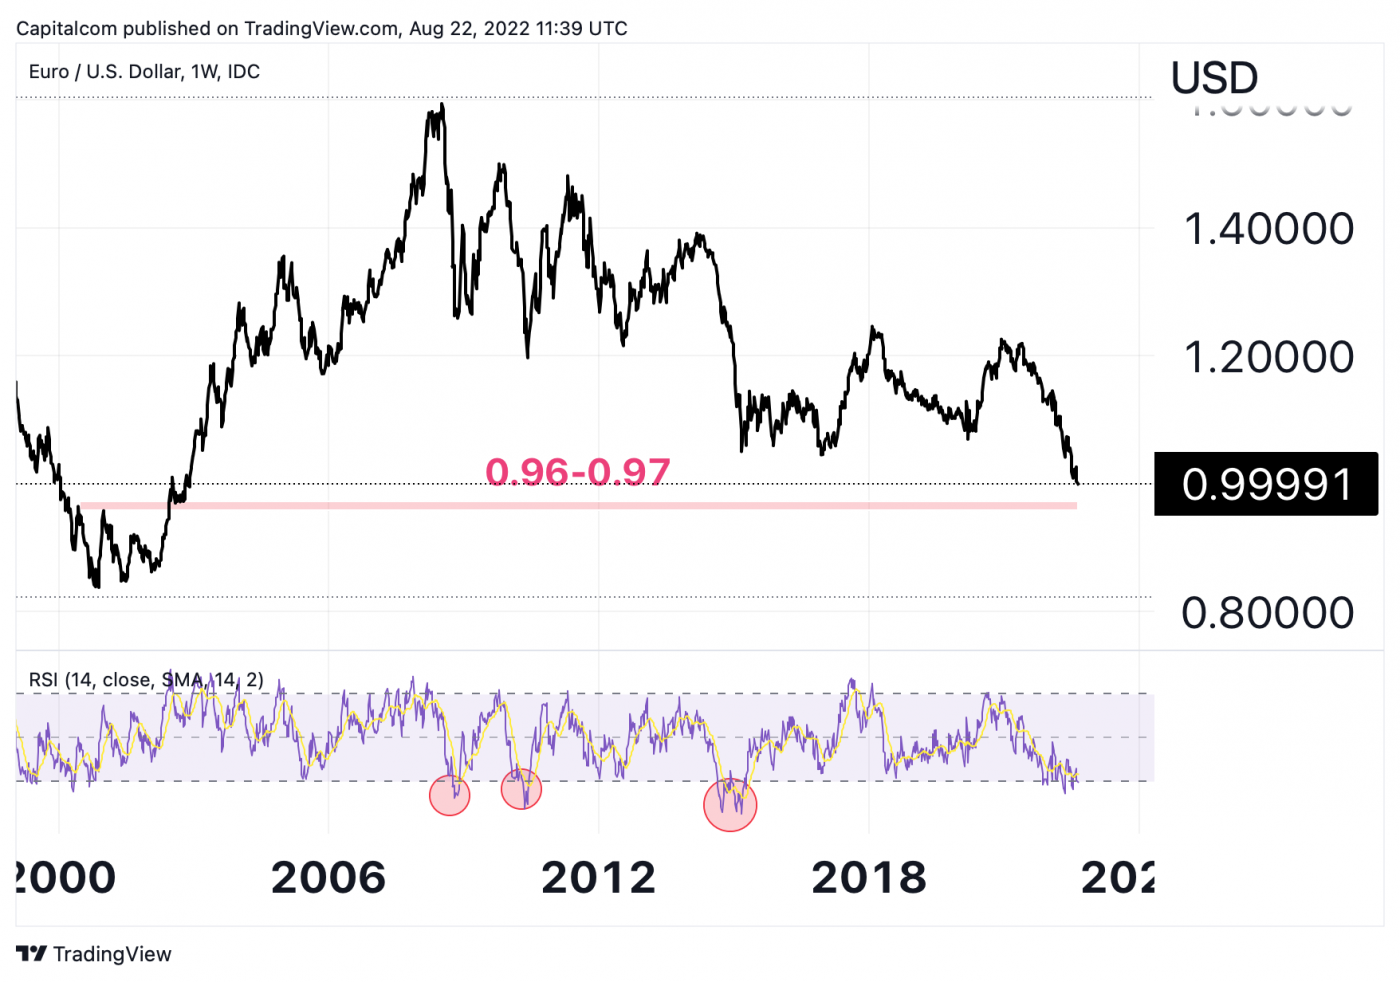
Looking at the weekly EUR/USD chart since 1999, the support area between 0.96 and 0.97 could be seen as an interesting test for the pair after it has decisively broken below the parity levels.
This region was a resistance between the summers of 2000 and 2002 before becoming a multi-decade support zone.
We are not yet close to reaching extreme levels of oversold weekly RSI, which in the past has allowed for some relief rallies of the single currency.
A further sharp decline from here could set off alarm bells in Frankfurt and prompt the European Central Bank to act to stem the rapid depreciation of the euro.
Analyst: Piero Cingari


Continue with Facebook Continue with Google